WEEKLY MARKET TRENDS VS MONTHLY TRACKING
In my post today it's all about price trends, and I hope this is helpful. It's topical, so skim quickly or digest slowly. It's important for sellers especially to be in touch with the market that actually exists. Simply put, weekly, monthly and quarterly market trends are the three kinds of trends that we utilize in our study of local residential real estate sales and market analysis. It’s highly cyclical - not predictable. For that reason, we are able to identify trends most accurately by analyzing the weekly data. With time, we can report a monthly update, which a lagging indicator - and this typically comes out around the 11th of the month (once the data is cured. As things typically trend in a seasonal fashion monthly/ quarterly/ annual etc., we have found the The San Francisco Bay Area is highly seasonal, showing robust activity in the Spring [March to June] and brisk sales in the Autumn [September - November].
Weekly trends provide us unique insights, such as a particular type of property that is selling higher than average, faster than usual or the volume of sales is low/ high compared to previous months. In turn, this could forecast a monthly trend building into a seasonal occurrence or point to an irregularity. What we saw with the amount of inventory during the months of 2020, was an oversupply of condominiums as homeowners left the City and were eager to sell, or an under-supply of Single Family homes leading to shorter days on market.
I share this data with my sellers in a much more focused fashion, since we can rely on seasonal data to calculate what an average amount of sales per-year/ or per-month, compared to average, and monitor how many active comparable properties are being sold in a certain building/ radius or neighborhood competing with their listing. This can be segmented by profile (bedroom/ bathroom count) or by price-point ( $1m - $2M) or even by price per square foot for the district.
I share this with my Buyers so that we can set realistic expectation for similar homes purchased this week/ this month, so we can carefully calculate the rate of appreciation - it is not uncommon that a comparable property will sell and sett the new “high mark” for price per square foot for the block/ area/ building and this can inform the next seller and lead to higher expectations. Let’s look at some examples:
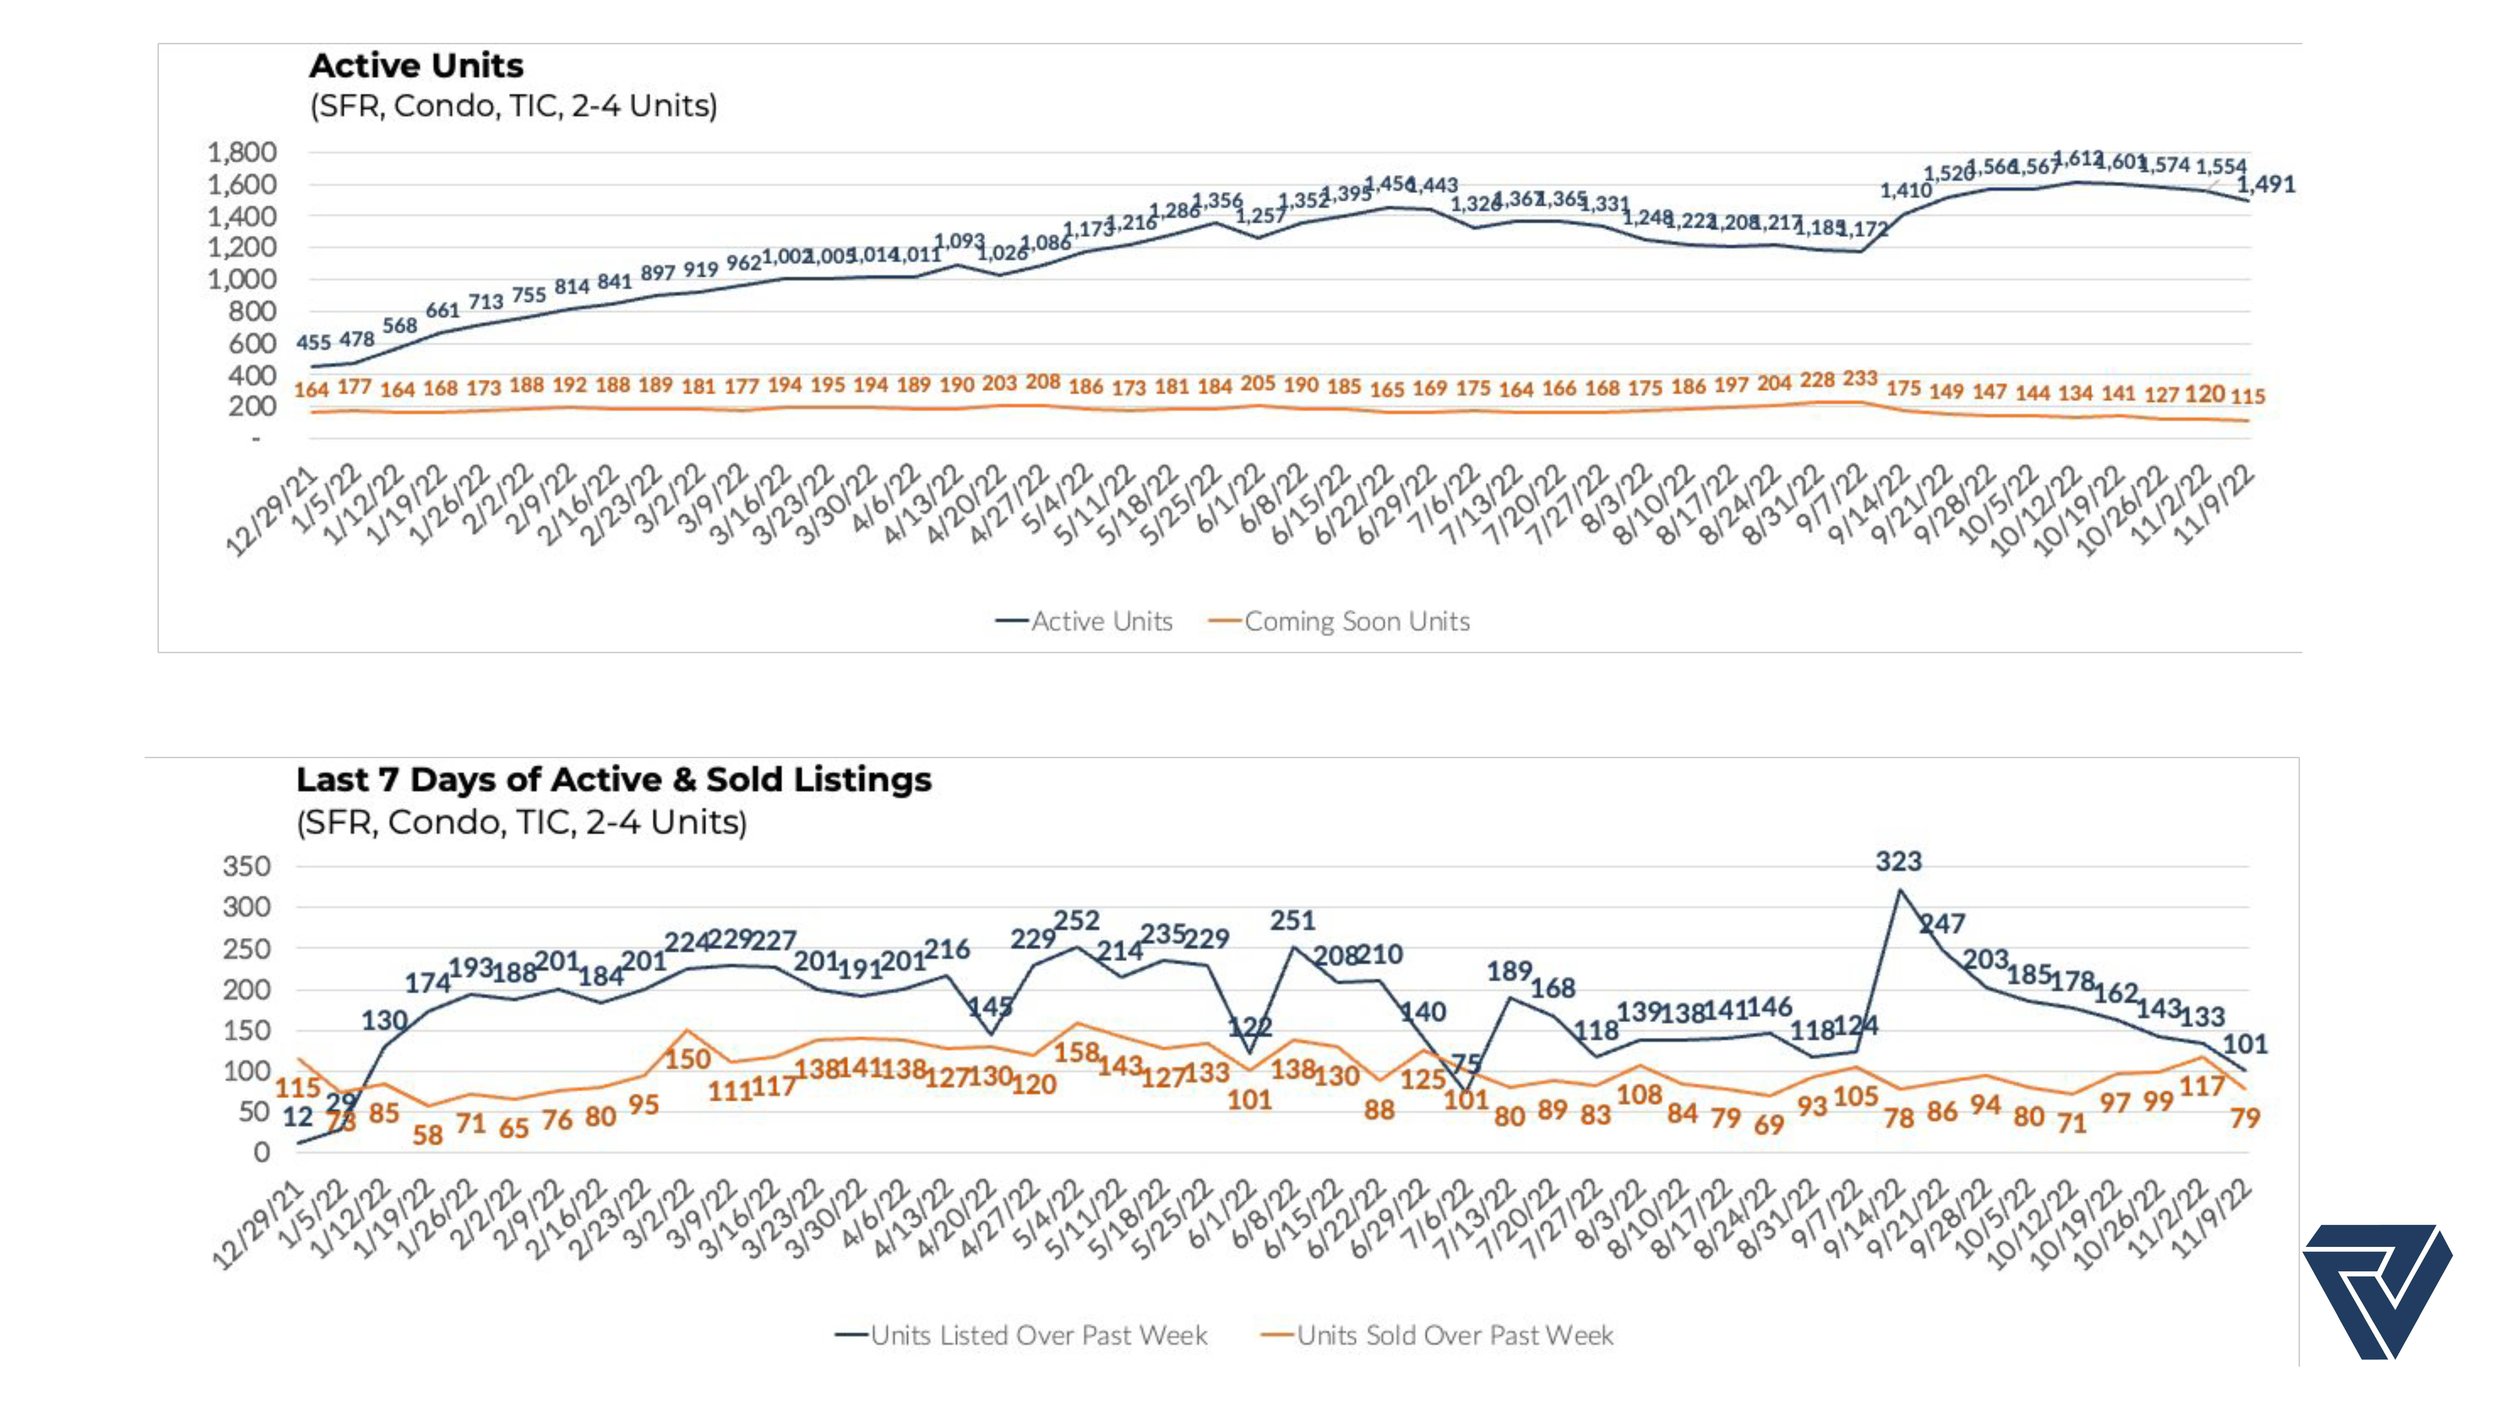
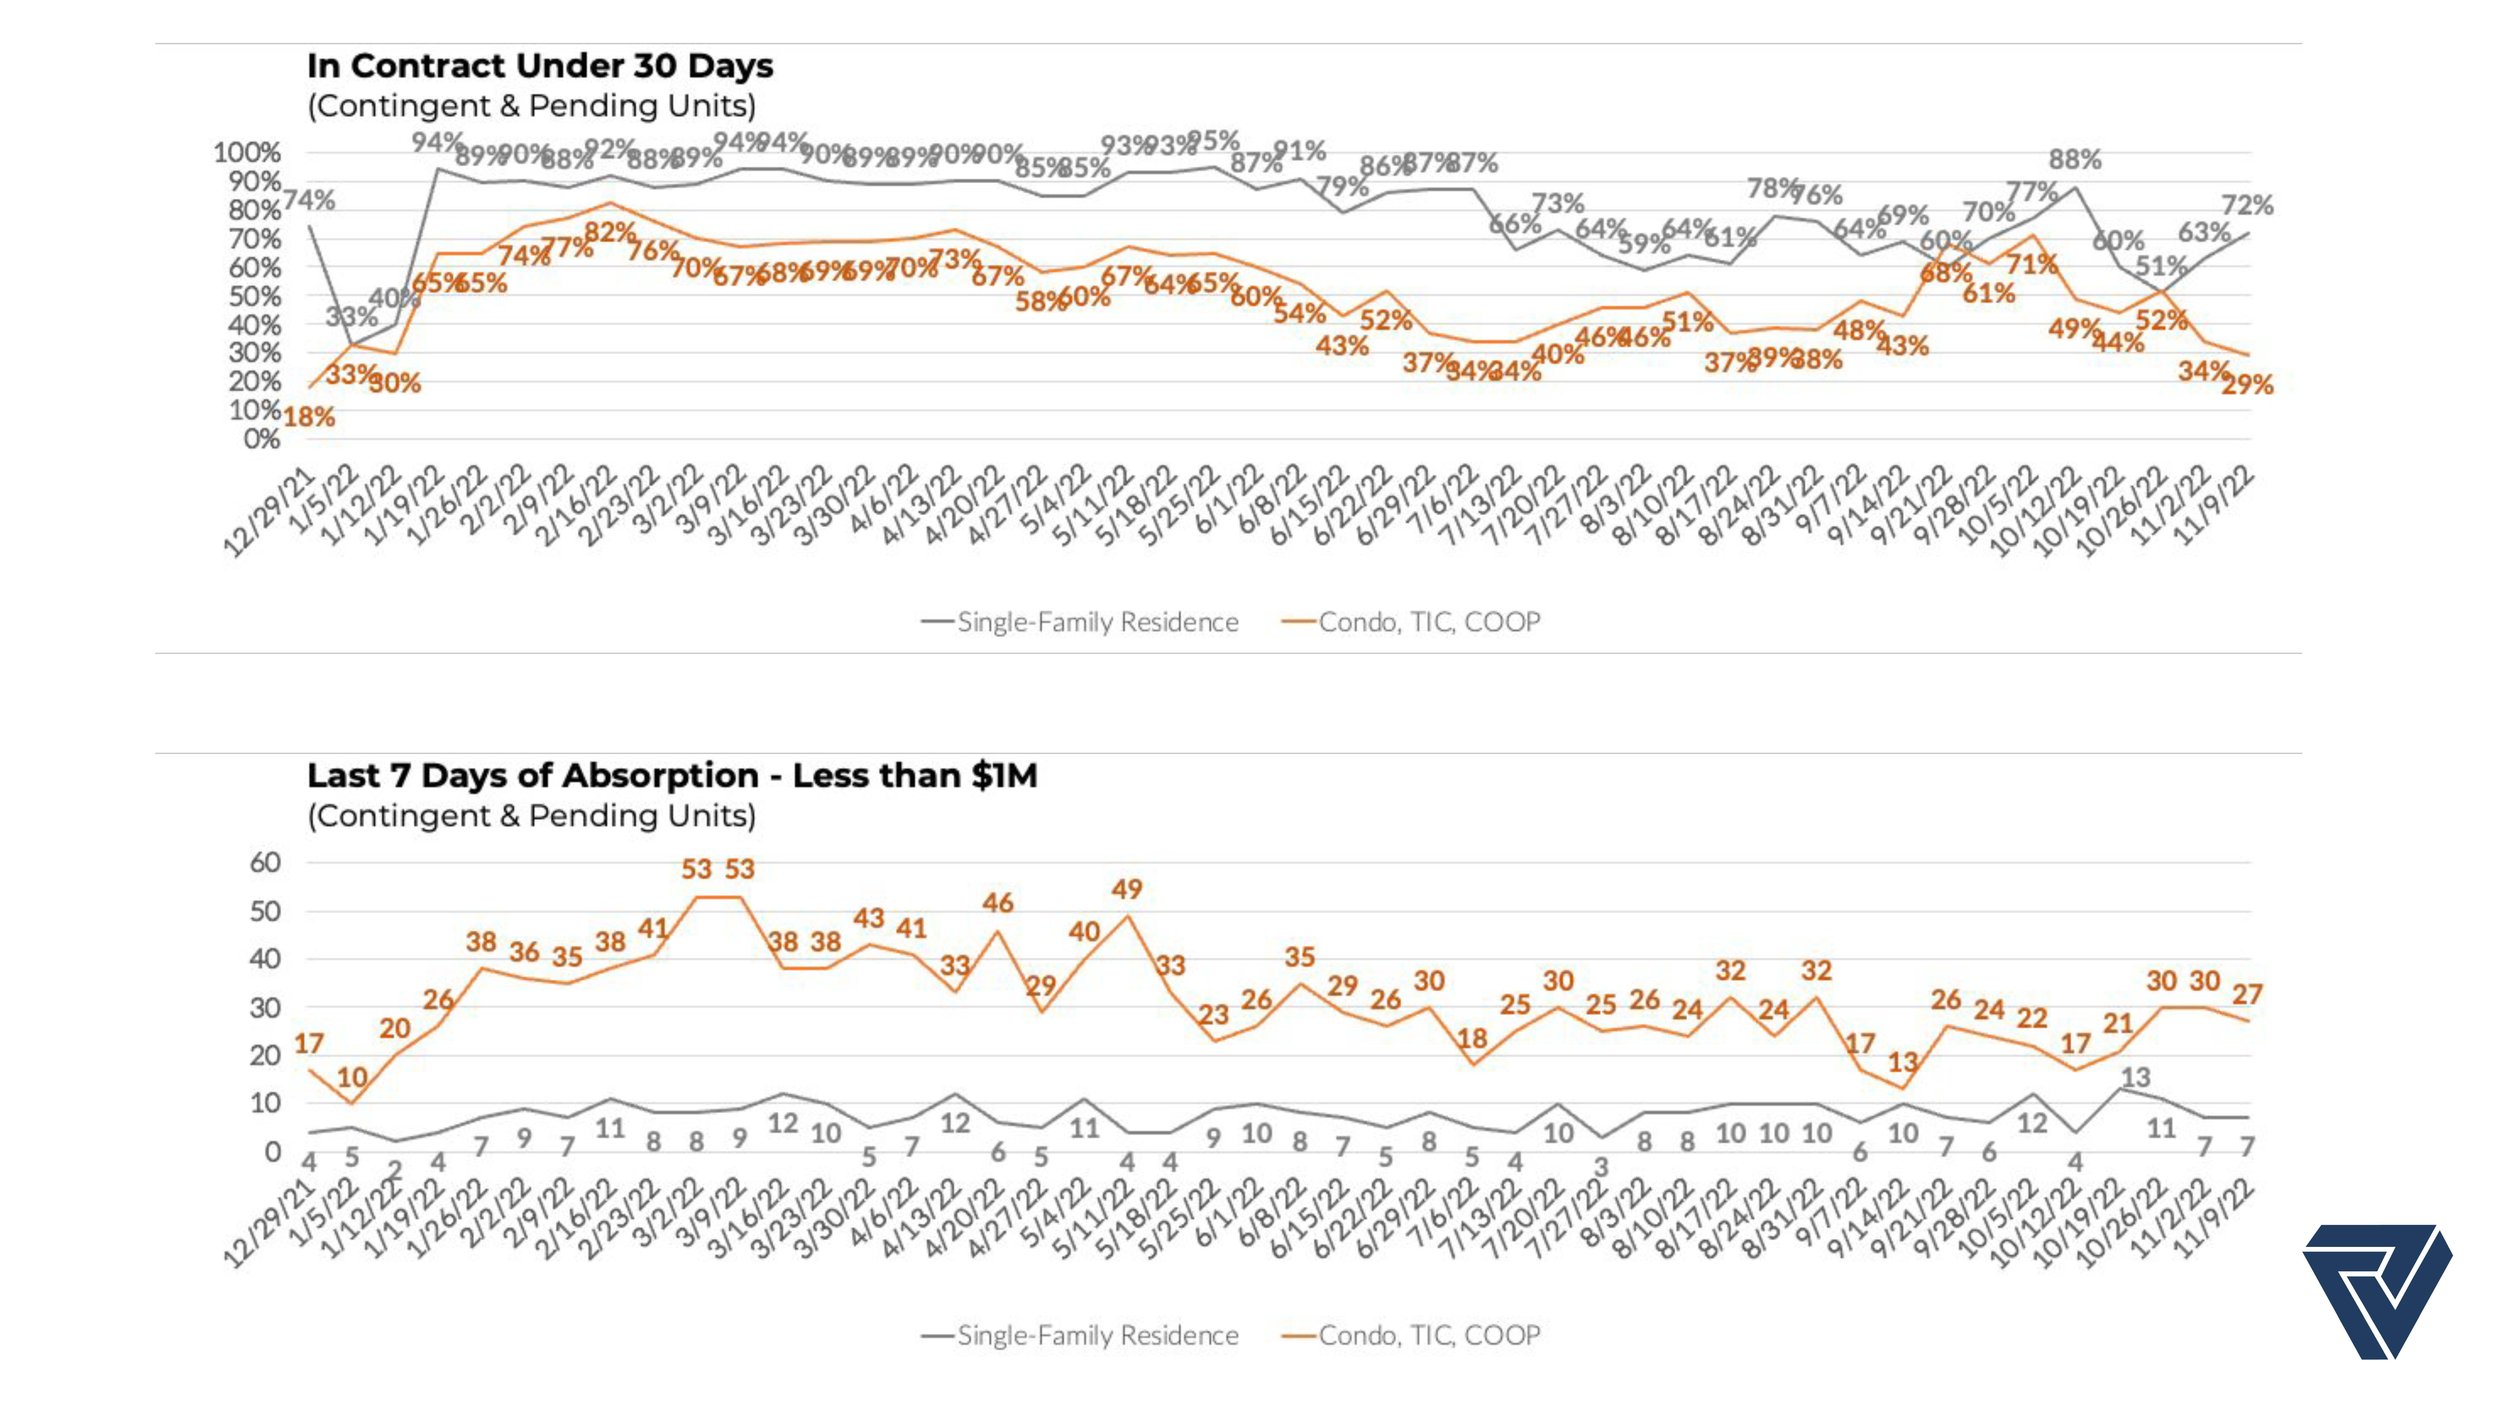
The “M” shapes of the data - starting in January are common trends, quiet sales in the winter leading to higher price sales in price-per square foot in the Spring-Summer, then soft in the Summer, again a spike in the Autumn, then quiet in the Winter. Over the past 5-years, value has appreciated, though now, condos are sagging since the past two years. This will make it hard for a seller o justify a higher value than the trends (which again, are lagging indicators).
For the real estate ractitioner, this is an important part of the job. For the data focused consumer, it may be interesting and so I will add that it is vital that we parse the data by property type, neighborhood and keep it as locally specific as possible - simply analyzing the data by zip code or City is insufficient to determine a property value. In the end - it is also affected by market dynamics, such as the demand for similar properties, the Buyer pool (those who missed out on the last similar property in the area) and the interest rates also play a role…
During a shifting market, with rising interest rates and an inflationary environment, you may be wondering: “Is my property value rising, or dropping, and what did my neighbor’s house sell for?” Estimating a home's market value is not an exact science. Because there is always a large difference in these valuations, please read my latest post on Market Insights How much is your "Home Value Report" worth?
Hope this helps. As always, please don’t hesitate to reach out to me with any questions or concerns. I'm here to support you!
Happy Hunting!